When I was a kid, I celebrated Thanksgiving with unusual aplomb. Part of it was recognizing the few days off from school as a prelude to a longer winter break, but the memories I hold most dear involve bundling up and taking a post-dinner hike into the woods. Here I would skirt the tree lines separating farmers’ fields and stomp my way through the snow. Eventually I’d find myself standing square in the center of a barren field, surrounded by yellow and gray grasses and bordered by leafless trees. Soon I’d hear that goofy and somehow soothing call of Canadian geese flying south towards warmer climates. We link to vendors to help you find relevant products. If you buy from one of our links, we may earn a commission.
Changes in the Garden
Those folks who’ve been gardening since the 2000s and before have probably noticed changes in growing patterns between then and now.
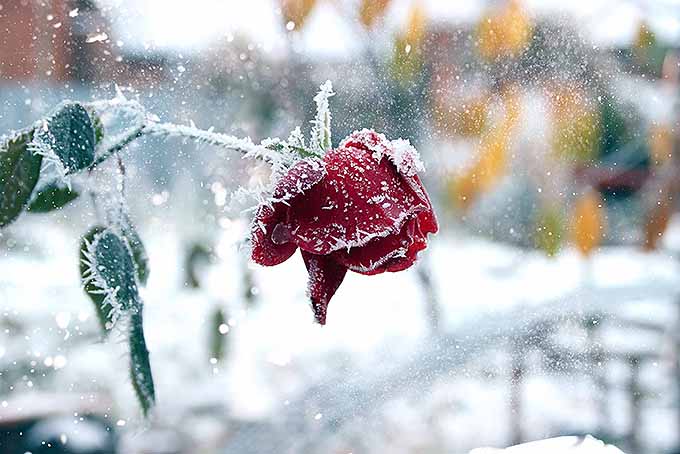
Annuals that ought to be toast by September are blooming through to November. Just a few weeks ago, I witnessed very confused apple trees and forsythia pushing out a late-autumn bloom. Sometimes it’s a sight of joy and excitement, and other times it’s a disconcerting observation when you’re wondering why your peppers are pushing new flowers in the first week of November. If you’ve seen these changes firsthand, you’re not alone.
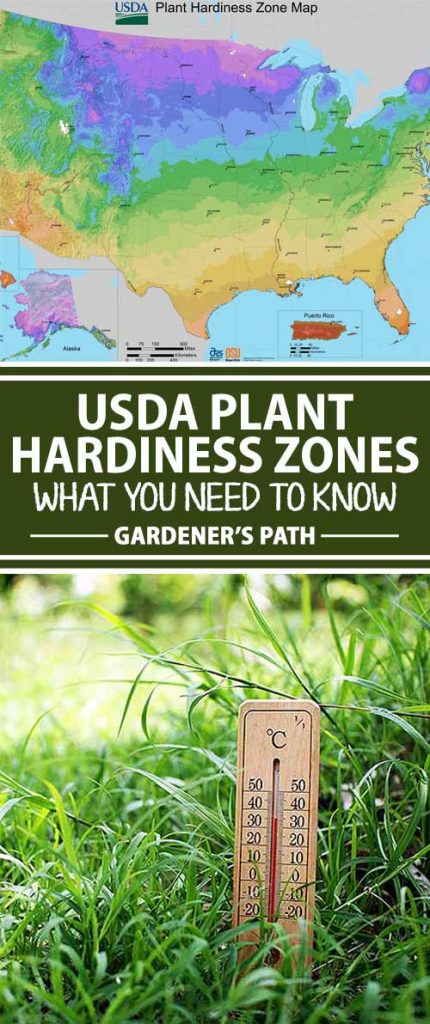
A Look at the USDA Growing Zone Map
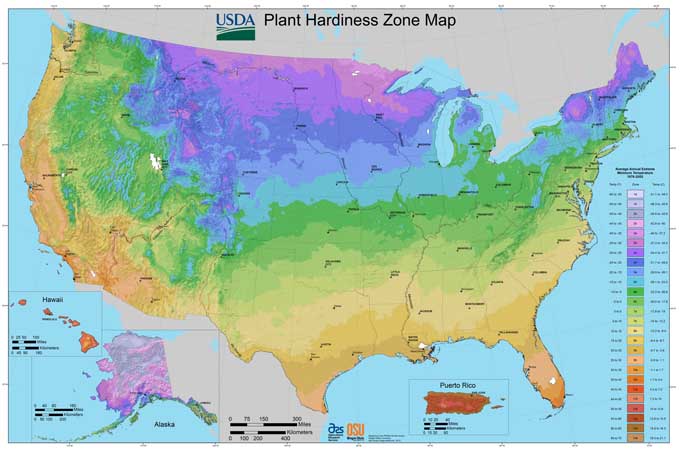
The United States Department of Agriculture has been a reliable authority for determining what plants can grow where in the United States. It relies on decades of records of weather patterns to determine the average highs and lows of any specific area. The USDA Plant Hardiness Zone Map’s origins stretch back to the 1960s, when Henry Skinner of the United States National Arboretum first devised a working map of plant hardiness zones. His original vision has transmuted into the USDA zones we’re familiar with today. Back in 1990, a growing database of climatic records prompted the first major change to this map, and in 2012 the map was updated again. We haven’t had an update since, and we probably shouldn’t expect one for some time.
But How Does It Work?
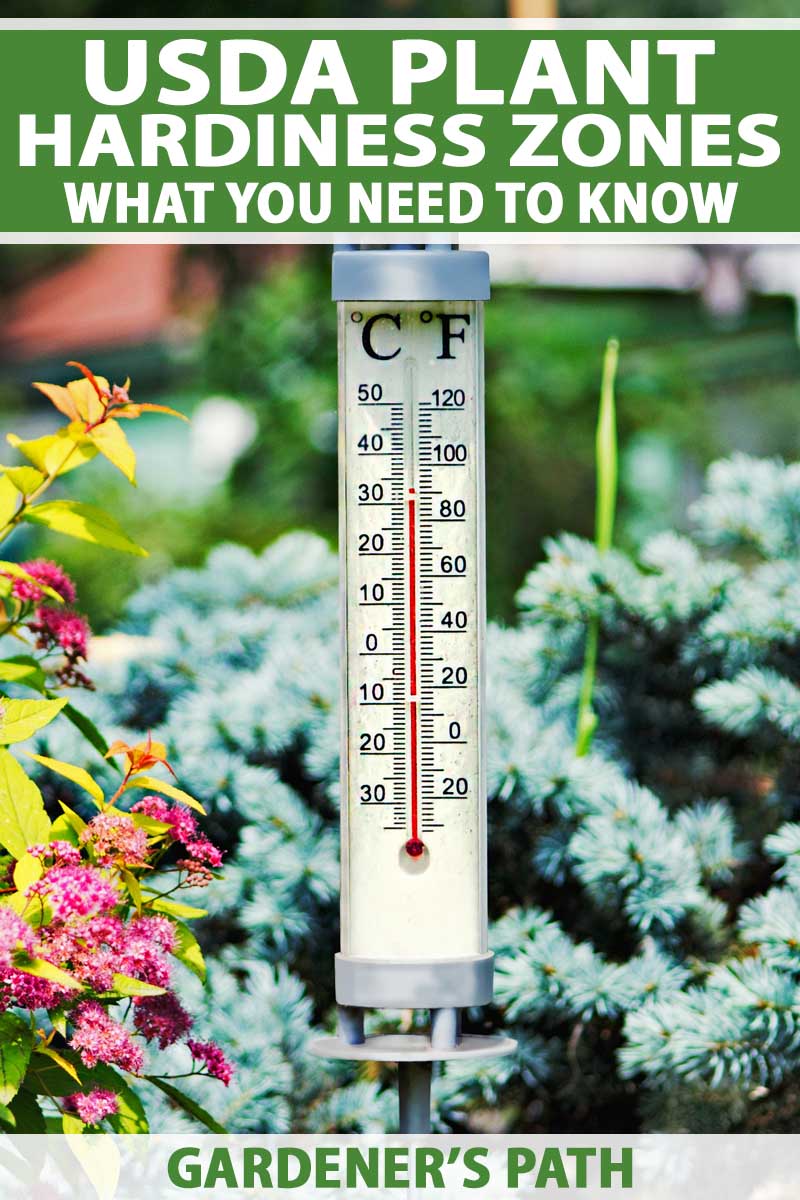
The plant hardiness zone map is separated into regions by average low temperature. The regions range from 1 to 13, with each individual region split into an “a” or “b” category. Each digit between 1 and 13 represents a 10-degree difference in the average low temperature, while the “a” or “b” narrows this temperature gap down to 5-degree increments. For example, Zone 7 has an average low temperature of 0 to 10 degrees Fahrenheit; 7a has a low of 0 to 5 degrees, and 7b has a low of 5 to 10 degrees. Zone 6 has an average low between -10 and 0 degrees, and Zone 8 has an average low between 10 and 20 degrees Fahrenheit.
The Climes, They Are A-Changin’
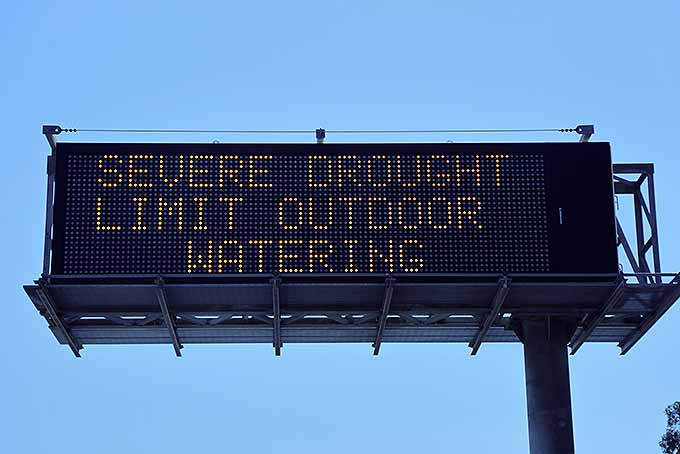
Although our planet is definitely getting warmer, this change in the USDA plant hardiness measurements between 1990 and 2012 is officially attributed to more accurate temperature measurements, and a system that takes into account a location’s closeness to bodies of water, elevation, and other micro-climate effects. However, just because a 6b in 1990 was relabeled as a 7a in 2012, it doesn’t necessarily indicate that certain plants can now grow in these warmer locations. In some areas, these climactic changes have been more gradual. In others, you can’t help but notice them. According to an article published in November 2019 in the Anchorage Daily News, these changes and their effects in the garden are undeniable. Gardening columnist Jeff Lowenfels says warming is happening two to three times faster in the Arctic than it is in other places on Earth, and at the time of writing he tracks a 20-month period of record-breaking temperatures. This affects planting times, bloom periods, and everything else, even the way gardeners may need to make adjustments to deal with weeds and newly invasive plants. If you started your garden before 2012, subtle changes in climate could explain why harvest times and dates of first and last blooms have shifted. And if you’ve been paying close attention to the more sensitive plants in your garden in the heat of summer, or the hardier plants during the winter chill, things may have changed since then as well. As always, the gardener must take into account the natural habitat of any plant they wish to grow (read more about when full sun doesn’t really mean full sun, for a start). Some plants thrive in hot weather, but also demand a humid and moist environment. So, the next time you’re shopping for plants and reading the tags like a dutiful gardener, keep in mind that the climes, they are a-changin’. To see what hardiness zone you live in, visit the USDA Plant Hardiness Zone Map website and pop in your zip code to find out. Keep in mind that the data you’re looking at was analyzed and documented in 2012, and consult your gardening journal as a point of comparison so you can adjust accordingly when planning and planting your first vegetable garden. What differences have you noted in your garden in the last few years, with the consistently warmer weather, frosts that arrive earlier, or periods of drought or excessive rain? Share in the comments! Snowy road photo by Matt Suwak, © Ask the Experts, LLC. ALL RIGHTS RESERVED. See our TOS for more details. Uncredited photos: Shutterstock. Last updated November 22, 2019. With additional writing and editing by Allison Sidhu.
